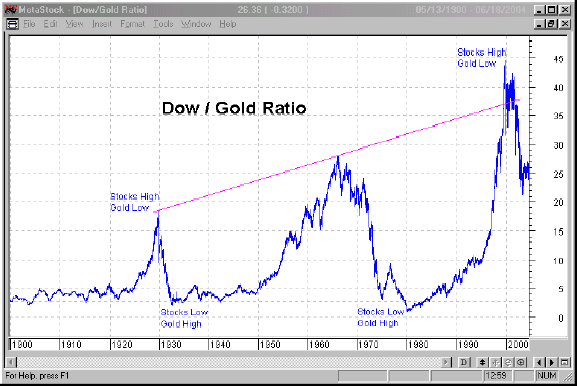
The biggest gold bugs have said for years that the price of gold usually mirrors the Dow Jones stock market index, and that it will eventually end up there again. For example, Peter Cooper recently wrote:
The Dow Jones Index will plunge again, way beyond the 7,000 limit target I suggested long ago for 2008, and head to 4-5,000, while at the same time the price per ounce of the yellow metal will tip the $4-5,000 an ounce level, way above the $2,000 now predicted by CitigroupI've never paid much attention to such claims, because they seemed unsubstantiated.However, last year PhD economist Krassimir Petrov looked at this question and said pretty much the same thing:
On the other hand, secular stock bear markets usually coincide with secular gold bull markets. At the secular peak for gold, the Gold-Dow ratio is in the range of 1-2. As you can see on the chart, 1900 recorded a low of 1.7; 1929 recorded a low of two; 1980 recorded a low of about one. This means that when the gold bull market peaks, the price of gold will roughly equal the Dow Jones Index (DJI). Thus, we should expect that gold outperform the DJI in the coming 10-15 years about 10-20 times, in order to bring that Dow-Gold Ratio down to the range of 1-2.
[Click for full chart] So, how high will gold go? The correct answer is simple: as high as Dow Jones.
I don't know much about Petrov. So what really caught my eye is that Marc Faber is saying something similar:"One day the price of gold will be higher than the Dow Jones."
In 2005, Faber posted the following chart:
"The CRB, a broad index of commodities, fell for 20 years in nominal terms, from 1980 to 1999. It is now up 12% and is still inexpensive. The Dow and the S&P are up substantially from the 1980s or early 1990s. Everyone thinks fiscal and monetary measures will work to fix the financial system. I don't. They will be disastrous and fuel inflation.

Simply put, since 2000, gold has risen at a much faster clip than the Dow Jones and I would expect this out-performance to continue for the next few years until "gold currency" holders will be able to buy one Dow Jones with just one ounce of gold.So, if Mr. Bernanke does what he believes in - namely that asset deflation has to be avoided at all cost and, therefore, massively prints money, no matter where the Dow will be in future, at 36,000, 40,000, or at 100,000, as some pundits predicted in their in 1999 published books (of course shortly before the market tumbled), you will be able to buy the Dow with ounce of gold worth either $36,000, $40,000 or $100,000.
Now, you may think that I have become insane. That is partially true because I am convinced that the US Fed's monetary policies will lead to exponentially widening wealth inequity and impoverish the majority of US households, which will then lead to social strive, protectionism, war, and the breakdown of the capitalistic system. However, if one considers that in 1932 and in 1980 (see figure 5) one could indeed buy one Dow Jones Industrial Average with just one ounce of gold, then maybe my views are rather conservative. Possibly one will be able to buy, sometime in future, one Dow Jones with just half an ounce of gold!

Hello,
ReplyDeleteJust curious, when I look at the chart you cite, it seems like the long term trend (green band) has been to move away from a gold/dow ratio of 1:1 - with only one example of a large move outside of this band. So how in the heck does this chart support your thesis of a 1:1 ratio? If anything it is saying that historically it should bottom out around 10:1 or at worst 5:1, right? Even if it were a 1-2 standard deviation move to the downside it would not be able to overcome the logarithmic nature of the longer term trend to reach 1:1. Just reading the graph...
What you fail to explain is why the longer term is a logarithmic move in the opposite direction of what you are espousing. Why, over time, is gold becoming less and less valuable relative to the DOW?
Finally, what is the math you chose to select a target ratio of 1:1? Because Faber said so?